BDSwiss App
Download & start trading

In this Analysis, we will delve into the Daily (D) timeframe to gain a comprehensive view of the current state of EURUSD, XAUUSD, GBPUSD, USOIL, & BTCUSD for Today, 17th April, 2024.
Additionally, we will briefly touch on a fundamental factor influencing its price.
EURUSD TECHNICAL ANALYSIS: 17th April , 2024
PRICE ACTION:
Scenario 1 (Short): There’s a scenario where some traders might think about short positions if the price stays below 1.07265
Scenario 2 (Long): In a different view, particularly for those more optimistic,
The idea of considering long positions could come into play if the price breaks above 1.07265 and Trendline Resistance
Quick Fundamental:
EURUSD saw a modest recovery after dipping towards 1.0600 on Tuesday, ending the day almost unchanged. The pair has remained relatively stable, fluctuating within a tight range just above 1.0600 during the European morning.
EURUSD DAILY CHART: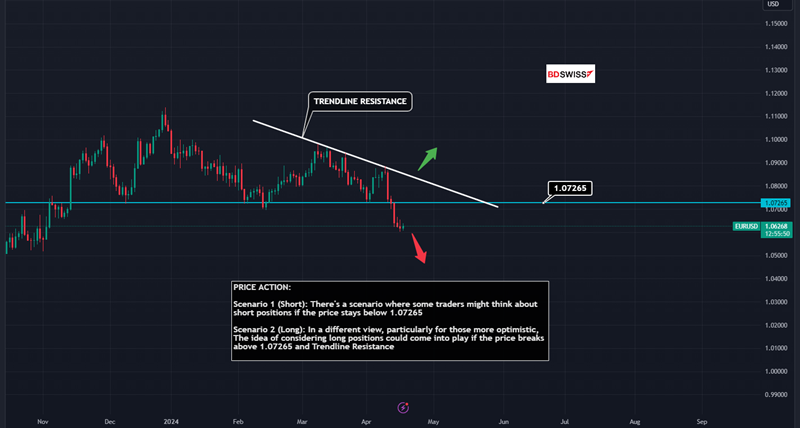 XAUUSD TECHNICAL ANALYSIS: 17th April, 2024
PRICE ACTION:
Scenario 1 (Short): It could be observed that there might be potential for short positions if the price breaks below $2364.588 and Trendline Support
Scenario 2 (Long): In a contrasting view, there might be potential for long positions if the price stays above $2364.588 which could interest those with an optimistic outlook.
Quick Fundamental: Gold remained stagnant in its movement on Tuesday, struggling to find a clear direction as increasing US Treasury bond yields counteracted any potential gains from the cautious market atmosphere. Early on Wednesday, the price of gold (XAUUSD) persisted in its sideways trend, staying above $2,370.
XAUUSD DAILY CHART: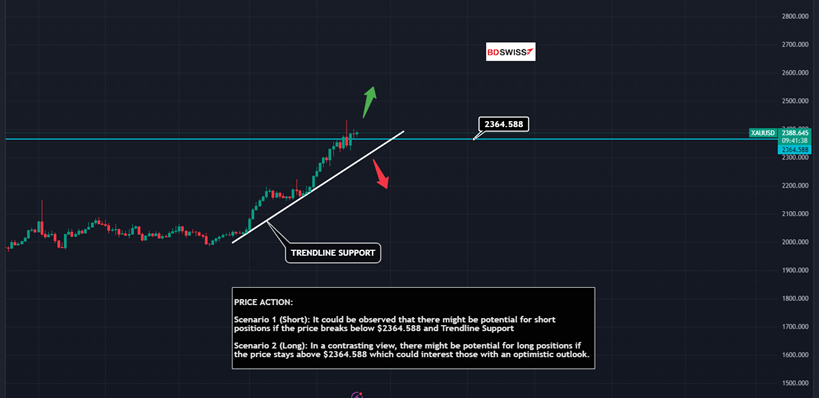 GBPUSD TECHNICAL ANALYSIS: 17th April, 2024
PRICE ACTION:
Scenario 1 (Short): Observationally, one might note a trend where short positions are initiated if price remains below 1.25758
Scenario 2 (Long): From an optimistic viewpoint, it could be noted that long positions may typically start if price breaks above 1.25758 and Trendline Resistance
Quick Fundamental: The UK’s Office for National Statistics announced on Wednesday morning that the annual inflation rate, based on the Consumer Price Index (CPI), decreased slightly to 3.2% in March from 3.4% in February. In the same timeframe, the core CPI, which excludes volatile items, increased to 4.2%. These figures exceeded analysts’ expectations, contributing to the strengthening of the Pound Sterling. After remaining stable just above 1.2400 during the Asian trading session, the GBPUSD pair gained momentum and approached 1.2450.
GBPUSD DAILY CHART: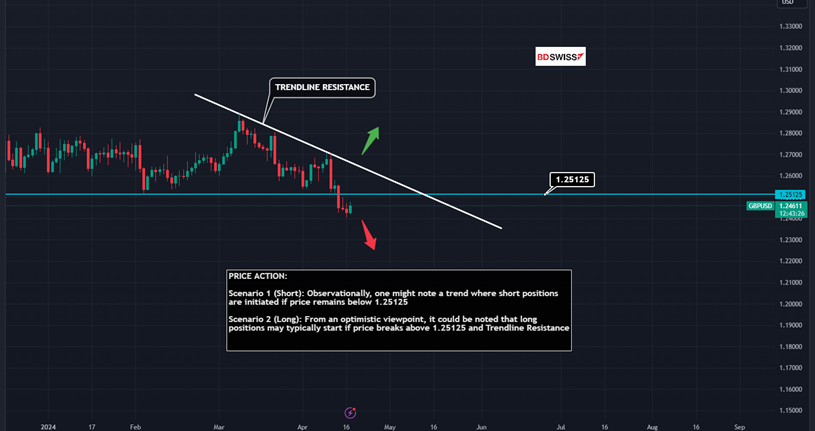 USOIL(WTI) TECHNICAL ANALYSIS: 17th April, 2024
PRICE ACTION:
In Scenario 1, there’s a tendency for short positions when the price stays below $83.05 and Trendline Support
In Scenario 2, it’s often observed that long positions are considered when if price breaks above $87.53, especially among optimists.
Quick Fundamental: WTI oil falls to $84.25, impacted by hawkish Fed remarks and expectations of delayed rate cuts, despite support from Middle East tensions and higher Chinese imports. Fed Chair Powell’s comments on persistent high US rates add pressure, hinting at reduced oil demand.
USOIL DAILY CHART: BTCUSD (BITCOIN) TECHNICAL ANALYSIS: 17th April, 2024
Bitcoin’s upcoming halving on April 19 is set to possibly ignite a significant rally in altcoins. Historical data from previous Bitcoin halvings reveal a pattern where Bitcoin’s dominance drops and altcoin market capitalization surges within 12-18 months post-halving. For instance, after the 2016 and 2020 halvings, Bitcoin’s market share drastically declined, while altcoins experienced substantial growth in value. This trend suggests that capital tends to rotate from Bitcoin to more speculative altcoins, including categories like meme coins and metaverse tokens, following the halving events.
PRICE ACTION:
Scenario 1 (Short): If one were looking at potential market movements, a scenario might involve contemplating short positions if the price stays below $64,492.87
Scenario 2 (Long): In a situation where market optimism prevails, one hypothetical approach could be to consider long positions if the price breaks above $64,492.87 and
Trendline Resistance
Quick Fundamental: On Tuesday, the crypto market was stable with a valuation close to $2.3 trillion and low volatility. Bitcoin’s market dominance rose to over 54%, influenced by the Bitcoin-ETF and waning interest in altcoins. There’s concern over Bitcoin’s price stability with no rebound after last week’s drop. Ethereum, meanwhile, struggled to maintain its position around the $3000 mark after a significant sell-off. This week’s calm in the crypto market may precede more volatile movements, potentially pushing Bitcoin down to $52-55K and Ethereum to $2500.
BTCUSD DAILY CHART: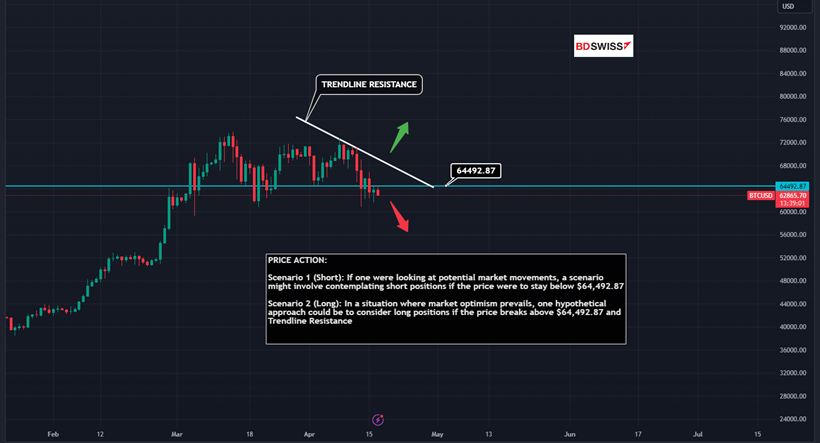 SOURCE : FXSTREET.COM | TRADINGVIEW.COM
 Ebuka Golden
Posted on 02 May, 2024 at 11:48 GMT
Posted on 30 April, 2024 at 15:03 GMT
Posted on 29 April, 2024 at 11:07 GMT
Posted on 26 April, 2024 at 15:25 GMT
Posted on 26 April, 2024 at 10:54 GMT