BDSwiss App
Download & start trading

In this Analysis, we will delve into the Daily (D) timeframe to gain a comprehensive view of the current state of EURUSD, XAUUSD, GBPUSD, USOIL, & BTCUSD for Today, 24th April, 2024.
Additionally, we will briefly touch on a fundamental factor influencing its price.
EURUSD TECHNICAL ANALYSIS: 24th April , 2024
PRICE ACTION:
Scenario 1 (Short): There’s a scenario where some traders might think about short positions if the price stays below 1.07265
Scenario 2 (Long): In a different view, particularly for those more optimistic,
The idea of considering long positions could come into play if the price breaks above 1.07265 and Trendline Resistance
Quick Fundamental:
On Tuesday, the EURUSD saw a 0.5% increase, surpassing the 1.0700 mark for the first time in more than a week. Throughout the European morning, the pair remained relatively stable around the 1.0700 level.
EURUSD DAILY CHART: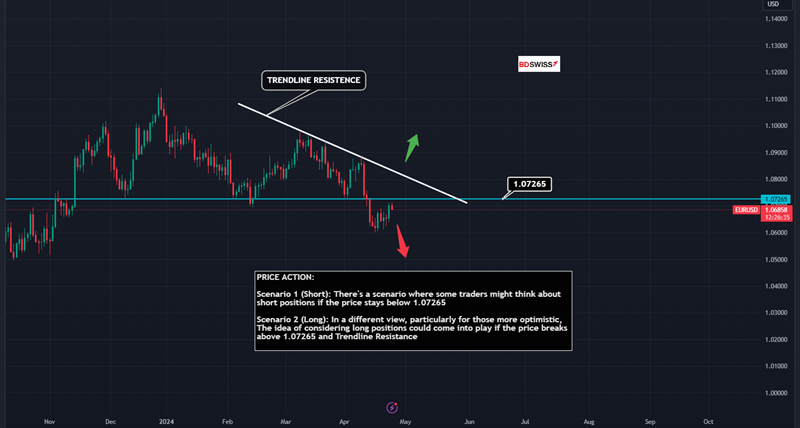 XAUUSD TECHNICAL ANALYSIS: 24th April, 2024
PRICE ACTION:
Scenario 1 (Short): It could be observed that there might be potential for short positions if price stays below $2363.839
Scenario 2 (Long): In a contrasting view, there might be potential for long positions if the price breaks above $2363.839 which could interest those with an optimistic outlook.
Quick Fundamental: Following its most substantial single-day decline of the year, plummeting over 2.5% on Monday, Gold extended its downward trajectory, breaching the $2,300 mark for the first time in almost three weeks on Tuesday. Despite a slight recovery later in the day for XAUUSD, it struggled to gain traction. As of early Wednesday, the pair remains range-bound, hovering around $2,320.
XAUUSD DAILY CHART: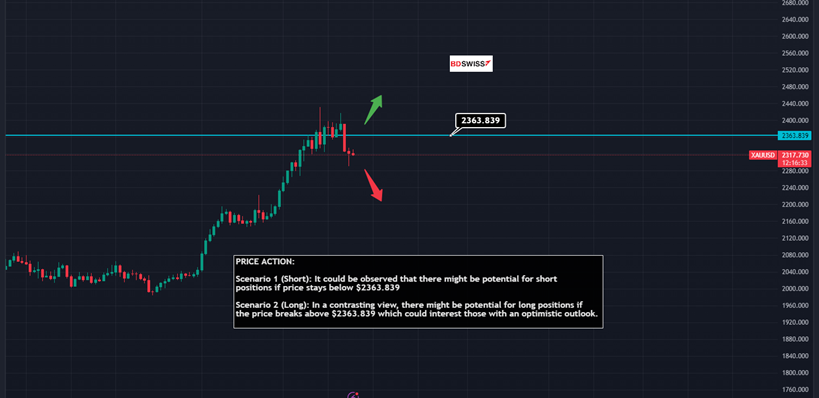 GBPUSD TECHNICAL ANALYSIS: 24th April, 2024
PRICE ACTION:
Scenario 1 (Short): Observationally, one might note a trend where short positions are initiated if price breaks below 1.24048
Scenario 2 (Long): From an optimistic viewpoint, it could be noted that long positions may continue if price stays above 1.24048 and Trendline Resistance
Quick Fundamental: On Tuesday, GBPUSD saw a boost from the widespread weakness of the USD, leading to a 0.8% gain and breaking a three-day losing trend. Early Wednesday, the pair maintained its stability, hovering around 1.2450.
GBPUSD DAILY CHART: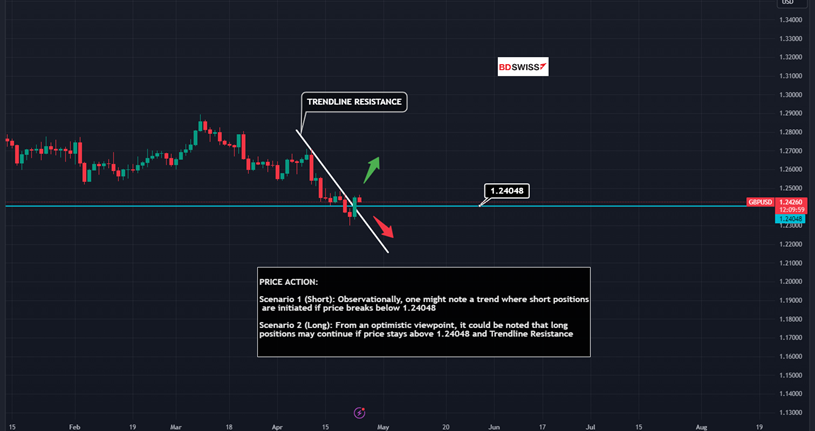 USOIL(WTI) TECHNICAL ANALYSIS: 24th April, 2024
PRICE ACTION:
In Scenario 1, there’s a tendency for short positions when the price breaks below $83.05
In Scenario 2, it’s often observed that long positions are considered when if price stays above $83.05, especially among optimists.
Quick Fundamental: West Texas Intermediate (WTI) US crude oil prices struggle to gain momentum, hovering around $83.25 after bouncing off the 50-day Simple Moving Average (SMA) support near $80.75. Geopolitical tensions in the Middle East ease slightly as Iran indicates no retaliation to Israeli strikes, reducing risk premium. However, ongoing Israel-Hamas conflict maintains geopolitical risks. Expectations of central bank rate cuts to spur economic growth and a surprise drop in US crude inventories support prices, indicating optimism in demand.
USOIL DAILY CHART: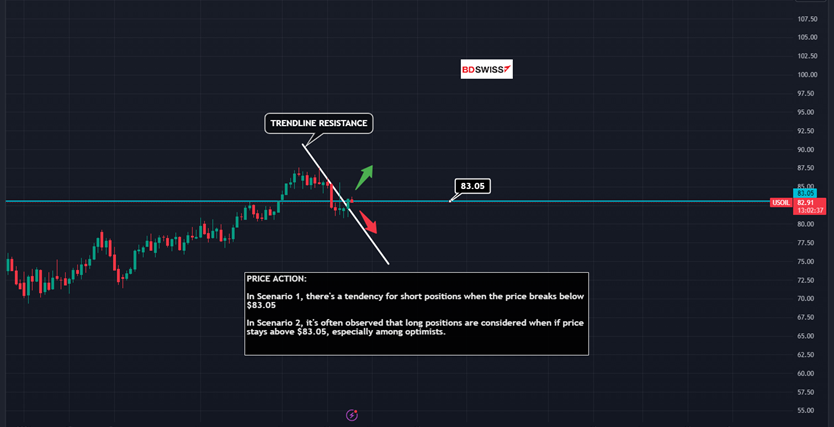 BTCUSD (BITCOIN) TECHNICAL ANALYSIS: 24th April, 2024
The price of Bitcoin has reached $66,000, with transaction fees decreasing from their peak of $128 on April 20 during the hype surrounding the halving. Bitcoin’s strength remains evident around $60,000, safeguarding the lower end of the re-accumulation range near $59,195.
In Switzerland, there are calls from Bitcoin enthusiasts for the National Bank to acquire BTC as part of its national reserves, aiming for independence from the European Central Bank.
While there’s growing potential for an upward movement in Bitcoin’s price, doubts linger about its sustainability. Experts foresee bearish scenarios, suggesting a possible correction before any significant upward momentum. This sentiment aligns with Arthur Hayes’ prediction that the halving event might have been overhyped, resulting in a “sell the news” reaction.
PRICE ACTION:
Scenario 1 (Short): If one were looking at potential market movements, a scenario might involve contemplating short positions if the price stays below Trendline Resistance
Scenario 2 (Long): In a situation where market optimism prevails, one hypothetical approach could be to consider long positions if the price breaks above Trendline Resistance
BTCUSD DAILY CHART: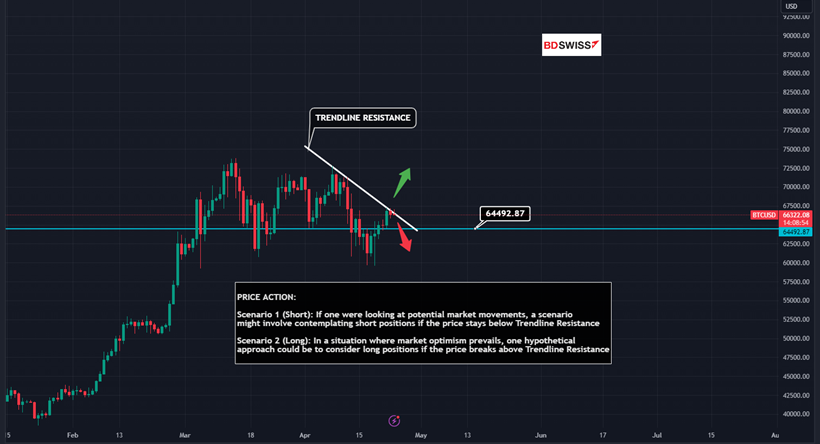 SOURCE : FXSTREET.COM | TRADINGVIEW.COM
 Ebuka Golden
Posted on 02 May, 2024 at 11:48 GMT
Posted on 30 April, 2024 at 15:03 GMT
Posted on 29 April, 2024 at 11:07 GMT
Posted on 26 April, 2024 at 15:25 GMT
Posted on 26 April, 2024 at 10:54 GMT