BDSwiss App
Download & start trading

Previous Trading Day’s Events (24.04.2024)
Data from the Australian Bureau of Statistics on Wednesday showed the consumer price index (CPI) rose 1% in the first quarter, above market forecasts of 0.8%. For March alone, the CPI rose 3.5% compared to the same month a year earlier, up from 3.4% in February.
“It’s higher than we were expecting, higher than what the market was expecting and higher than what the RBA would be expecting so that 1% number will be something that they’ll be alarmed about,” said Madeline Dunk, an economist at ANZ that tipped for a first-rate cut in November.
The Reserve Bank of Australia has left interest rates at 4.35% for three straight meetings as confidence had grown that inflation was on track to ease back to its target band of 2-3% in late 2025.
“From a narrow GDP accounting perspective, there should be no material impact on estimates for tomorrow’s first-quarter GDP growth,” said Conrad DeQuadros, senior economic advisor at Brean Capital. “The positive takeaway from this is that the report suggests that weakness in manufacturing does not appear to be intensifying, but neither are there signs of recovery.”
March’s increase was in line with economists’ expectations. Core capital goods orders gained 0.6% year-on-year in March.
Business spending on equipment has struggled in the aftermath of 525 basis points worth of interest rate hikes from the Federal Reserve since March 2022 to tame inflation. Though the U.S. central bank is expected to start lowering rates this year, the timing of the first cut is uncertain
Source: https://www.reuters.com/markets/us/us-core-capital-goods-orders-rise-moderately-march-2024-04-24/
______________________________________________________________________
Winners vs Losers
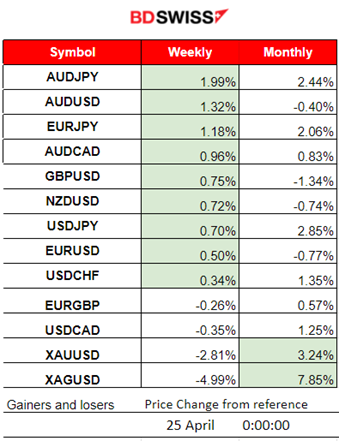
AUDJPY remains on the top of the weekly list of gainers with 1.99% gains. Silver performance fell to 7.85% but still leading this month. The dollar strengthened yesterday and metals retreated. USDJPY is rising exponentially.
 ______________________________________________________________________
News Reports Monitor – Previous Trading Day (24.04.2024)
Server Time / Timezone EEST (UTC+03:00)
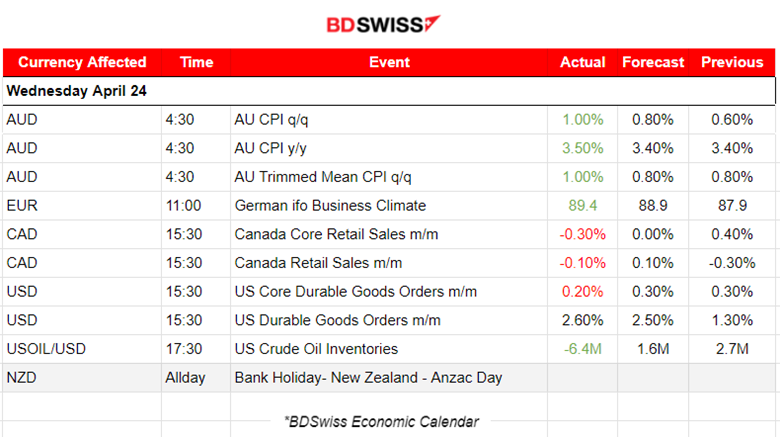
Australia’s inflation report showed that the monthly CPI indicator rose 3.5% in the 12 months to March. The annual figure was reported higher at 3.5% from 3.4% which was steady for 3 readings in a row. The AUD appreciated at the time of the release. AUDUSD jumped near 30 pips before retracement took place back to the 30-period MA.
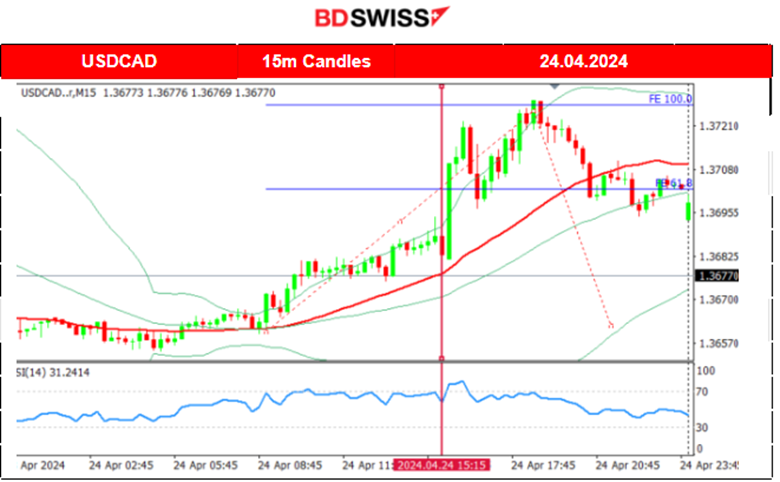
Canada retail sales figure releases showed that there are no signs of spending growth since the start of 2024. The latest figures show a decline in monthly core sales of -0.3% from the previously reported 0.4%. The retail sales figures showed a smaller decline of -0.1% versus the previous -0.3% decline. USDCAD jumped near 25 pips upon release due to CAD depreciation at that time.
The U.S. Durable goods figure releases at 15:30 showed more growth, 2.6% versus the 2.5% expected. No major impact was recorded affecting the USD pairs.
General Verdict:
 __________________________________________________________________
FOREX MARKETS MONITOR
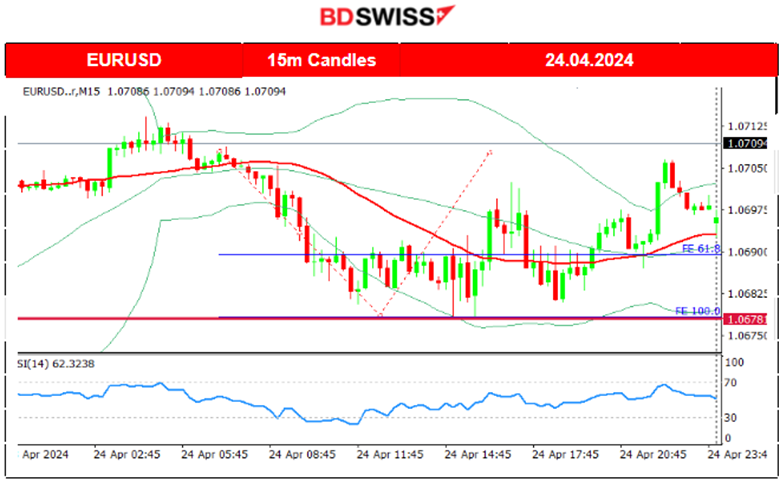
EURUSD (24.04.2024) 15m Chart Summary
Server Time / Timezone EEST (UTC+03:00)
Price Movement
The pair moved to the downside early, driven obviously by the USD strengthening. After the start of the European session, it found support at near 1.0678. The durable good news had no major impact but kept the pair to low levels. EURUSD continued with low volatility around the 30-period MA after that.
 USDCAD (24.04.2024) 15m Chart Summary
Server Time / Timezone EEST (UTC+03:00)
Price Movement
The pair moved early to the upside as the USD was strengthening early and later during the Canada retail sales figure releases the pair jumped as CAD faced depreciation. USDCAD reached an intraday strong resistance at near 1.37300 before retracing to the 30-period MA.
 ___________________________________________________________________
CRYPTO MARKETS MONITOR
BTCUSD (Bitcoin) Chart Summary 1H
Server Time / Timezone EEST (UTC+03:00)
Price Movement
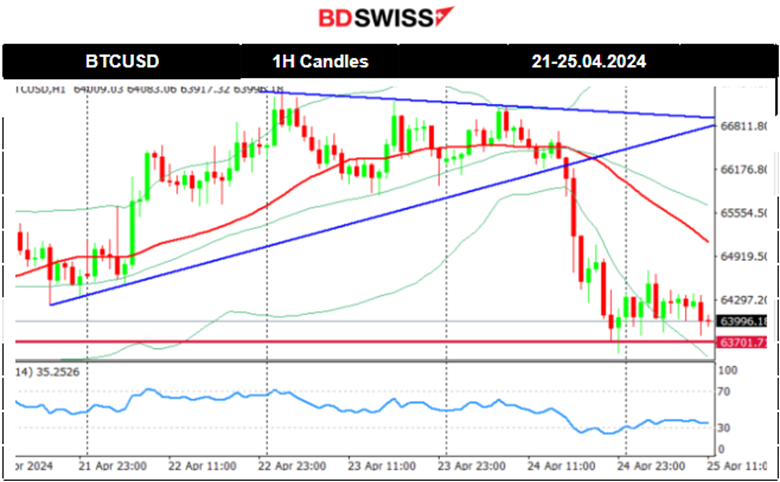
Bitcoin halving took effect late on Friday 19th April, cutting the issuance of new bitcoin in half. It happens roughly every four years, and in addition to helping to stave off inflation, it historically precedes a major run-up in the price of Bitcoin.
Its price started slowly to move to the upside and experienced an uptrend during the weekend. Since the 20th of April, the price moved to the upside post-halving. Bitcoin was on an uptrend with the price moving within a channel. Since the 23rd upside slowdown took place as volatility levels lowered forming a triangle, trading around the 67K USD level. On the 24th of April, a breakout of that triangle occurred to the downside, with the price reaching the support near 63,500 USD before retracement took place. Now it tests the lows again.
The new bill from Congress might be the cause:
 Crypto sorted by Highest Market Cap:
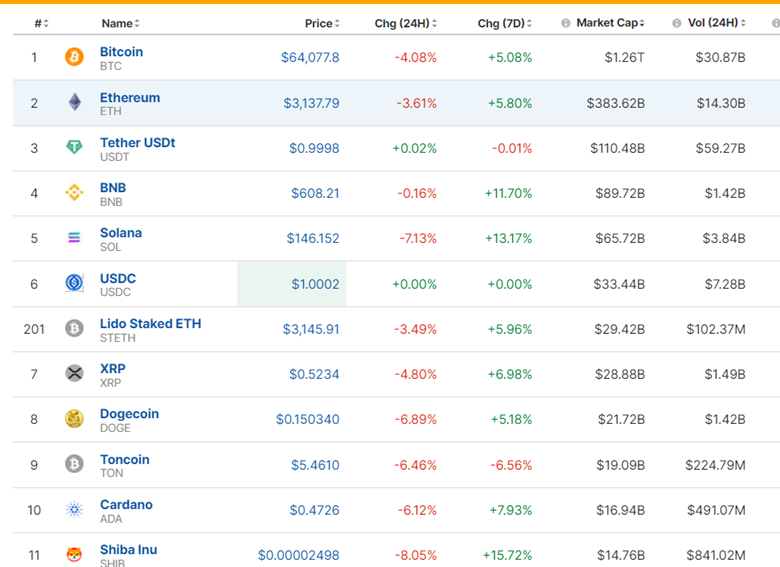
After “the halving”, the crypto market showed some performance. The last 24 hours though seem critical for the market as it shows great momentum to the downside.
Source: https://www.investing.com/crypto/currencies
______________________________________________________________________
EQUITY MARKETS MONITOR
S&P500 (SPX500) 4-Day Chart Summary
Server Time / Timezone EEST (UTC+03:00)
Price Movement
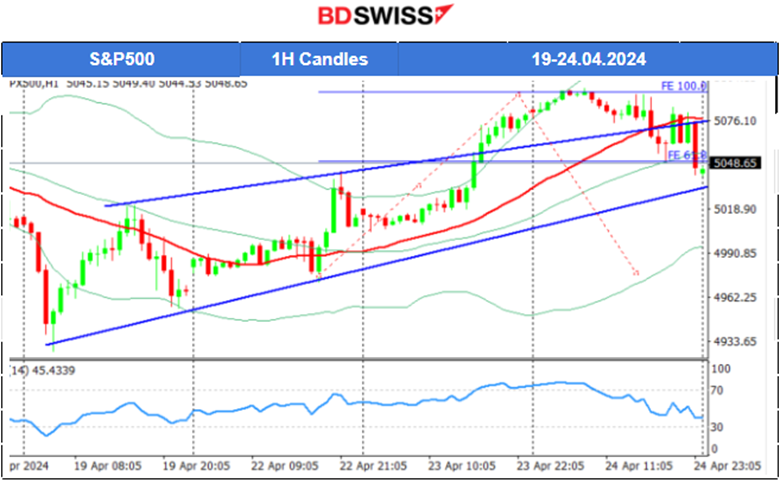
The index was on a downtrend recently as borrowing costs are expected to remain high, plus geopolitical tensions having an impact on expectations and a change to a risk-off mood. Breakout to the upside and of the 5,000 USD level led to a jump of 30 USD on the 22nd of April and a retracement took place soon after. This eventually was the start of an uptrend as mentioned in the previous analysis. The resistance of 5,040 USD tested again and the breakout that followed caused the price to reach 5,095 USD before retracement took place on the 24th of April.
 ______________________________________________________________________
COMMODITIES MARKETS MONITOR
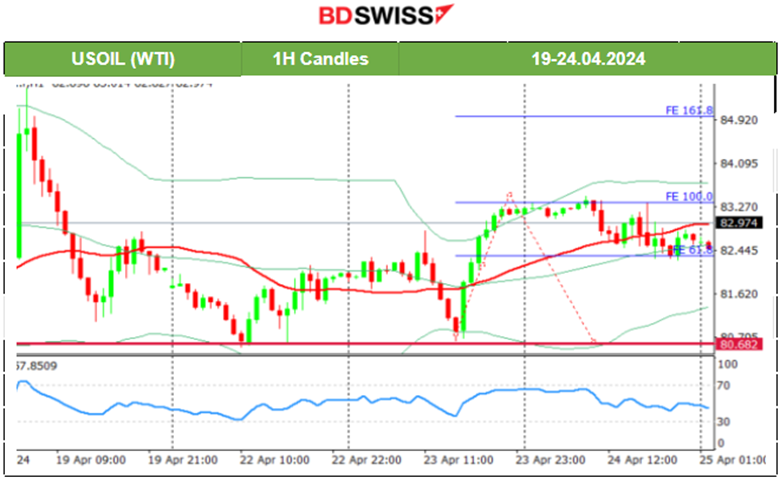
USOIL (WTI) 4-Day Chart Summary
Server Time / Timezone EEST (UTC+03:00)
Price Movement
On the 19th of April the news regarding the Israel attack in Iran, caused the commodity prices (Gold and Oil) to jump but only to reverse soon after fully. Currently, lower volatility levels form a triangle formation, and a breakout to the upside (which is possible considering the apparent bullish divergence) could lead the price to reach the 83.5 USD resistance. The 50-period Bollinger Band’s upper band supports the possible next target resistance to be at that level. Crude oil’s volatility could help the price to reach even the 85/b level which acts as a resistance level during this period. That could only be supported if the 82.7 USD/b level acts as an uptrend support now.
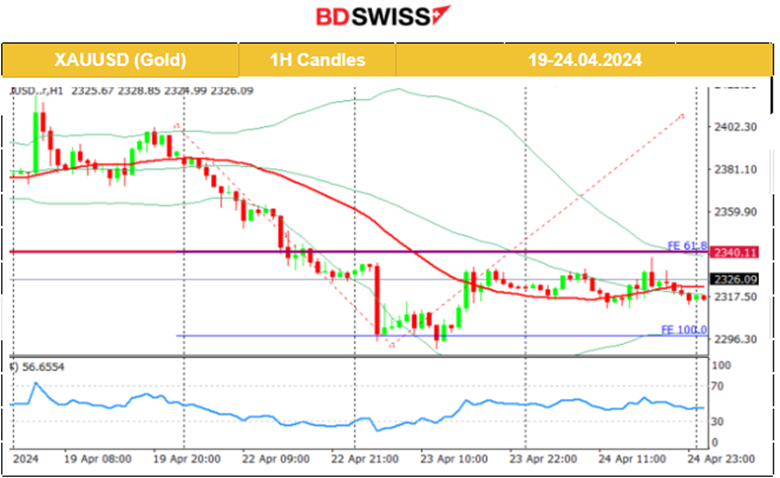
 XAUUSD (Gold) 4-Day Chart Summary
Server Time / Timezone EEST (UTC+03:00)
Price Movement
On the 18th of April, Gold stayed in range, flirting with the 2,390 USD/oz at some point but remaining close to the MA. On the 19th of April the news regarding the Israel attack in Iran, caused the commodity prices (Gold and Oil) to jump but only to reverse soon after fully. Gold retreated eventually lower reaching the support at 2,350 USD/oz. On the 22nd the downside path continued aggressively and today it even reached support at 2,300 USD/oz. That eventually acted as a turning point to the upside and a retracement to 2,330 USD/oz, close to the MA. On the 24th of April, the price remained stable. Could be the case that 2,340 could be tested again. Seems an important resistance level.
 ______________________________________________________________
News Reports Monitor – Today Trading Day (25 April 2024)
Server Time / Timezone EEST (UTC+03:00)
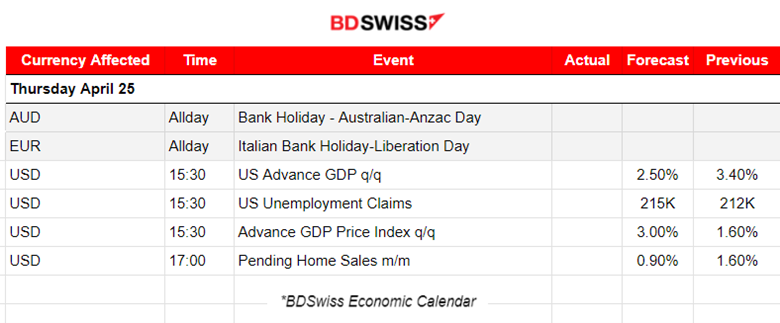
No important announcements, no special scheduled releases.
At 15:30 the Advanced GDP figure (q/q) for the U.S. will be released shedding some light on how the U.S. economy is growing. It could be the case that the market will experience a moderate intraday shock at the time of the release affecting the USD pairs.
General Verdict:
______________________________________________________________
 Marios Kyriakou
Posted on 02 May, 2024 at 15:07 GMT
Posted on 30 April, 2024 at 15:15 GMT
Posted on 29 April, 2024 at 11:59 GMT